


Hello,
We are here with the second issue of the Data Bulletin by Prison Agenda. In this issue, we examine the April, May, and June 2026 data published by the General Directorate of Prisons and Detention Houses (CTE).
Following the first quarter, we present an overview of the first half of the year, examining population mobility, demographic changes and educational backgrounds in prisons.
A small note: Since prison data is published at the start of each month and probation data at the end, the data for March, April, and May 2026 were analysed in our probation section.
1. By Execution Status: The Number of Prisoners Exceeded 420 Thousand
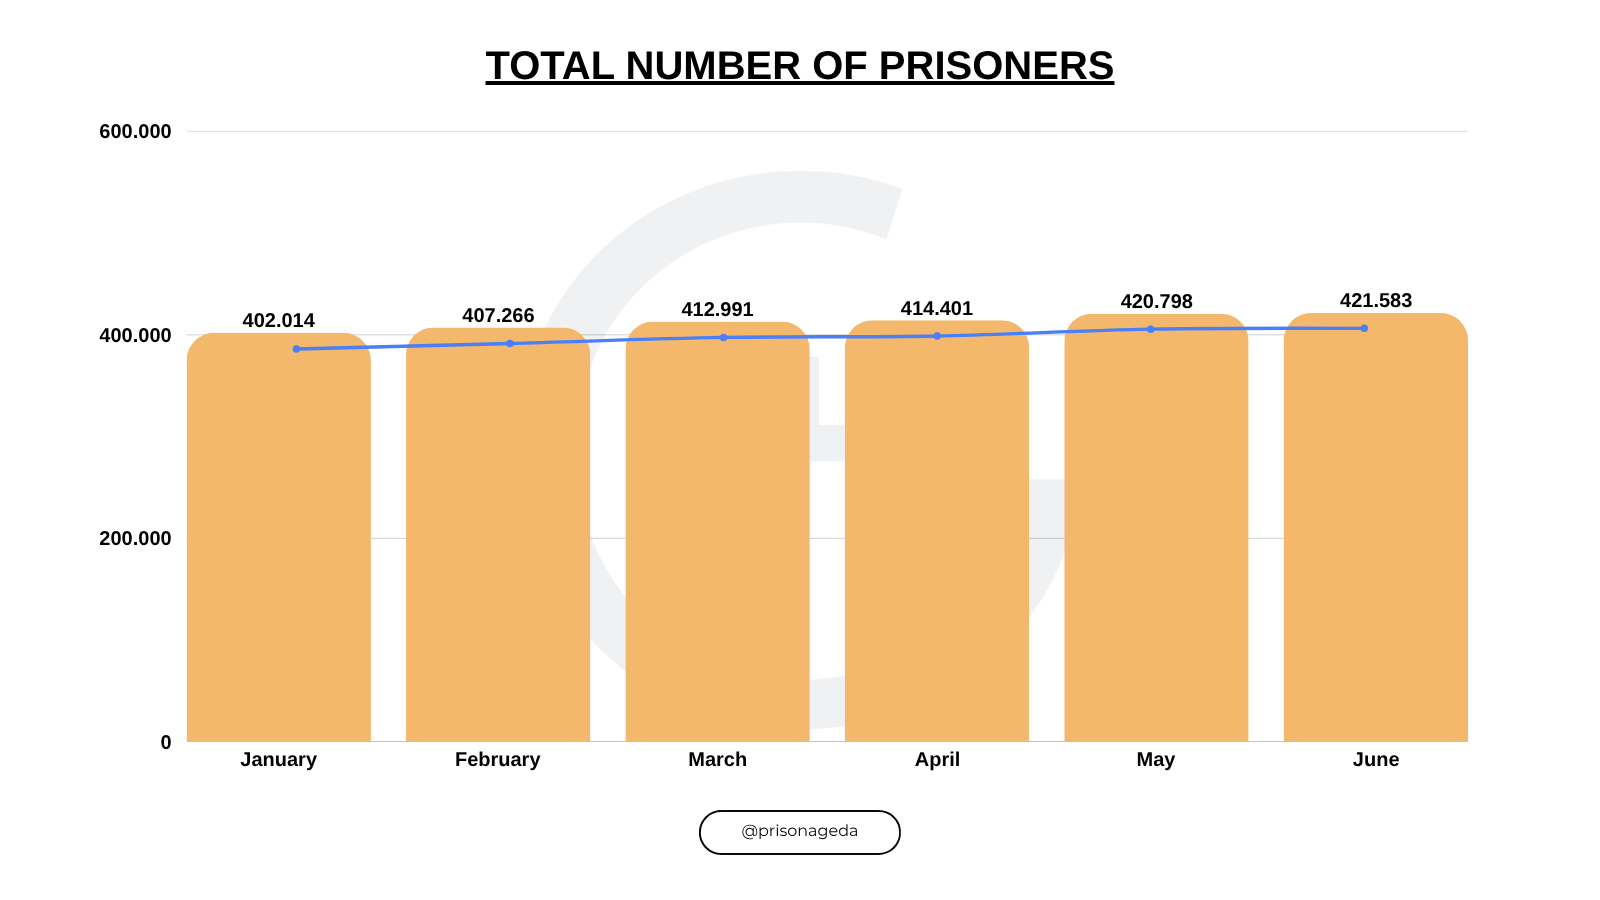
In the second quarter of 2026, the trend of population growth in prisons continued without slowing down. The total number of prisoners, which stood at 412 thousand in the first quarter, surpassed a psychological threshold once more, reaching 421,583 by June. Given that the total number of prisoners was 402,014 in January, the prison population increased by 4.87% in the first six months of 2026.
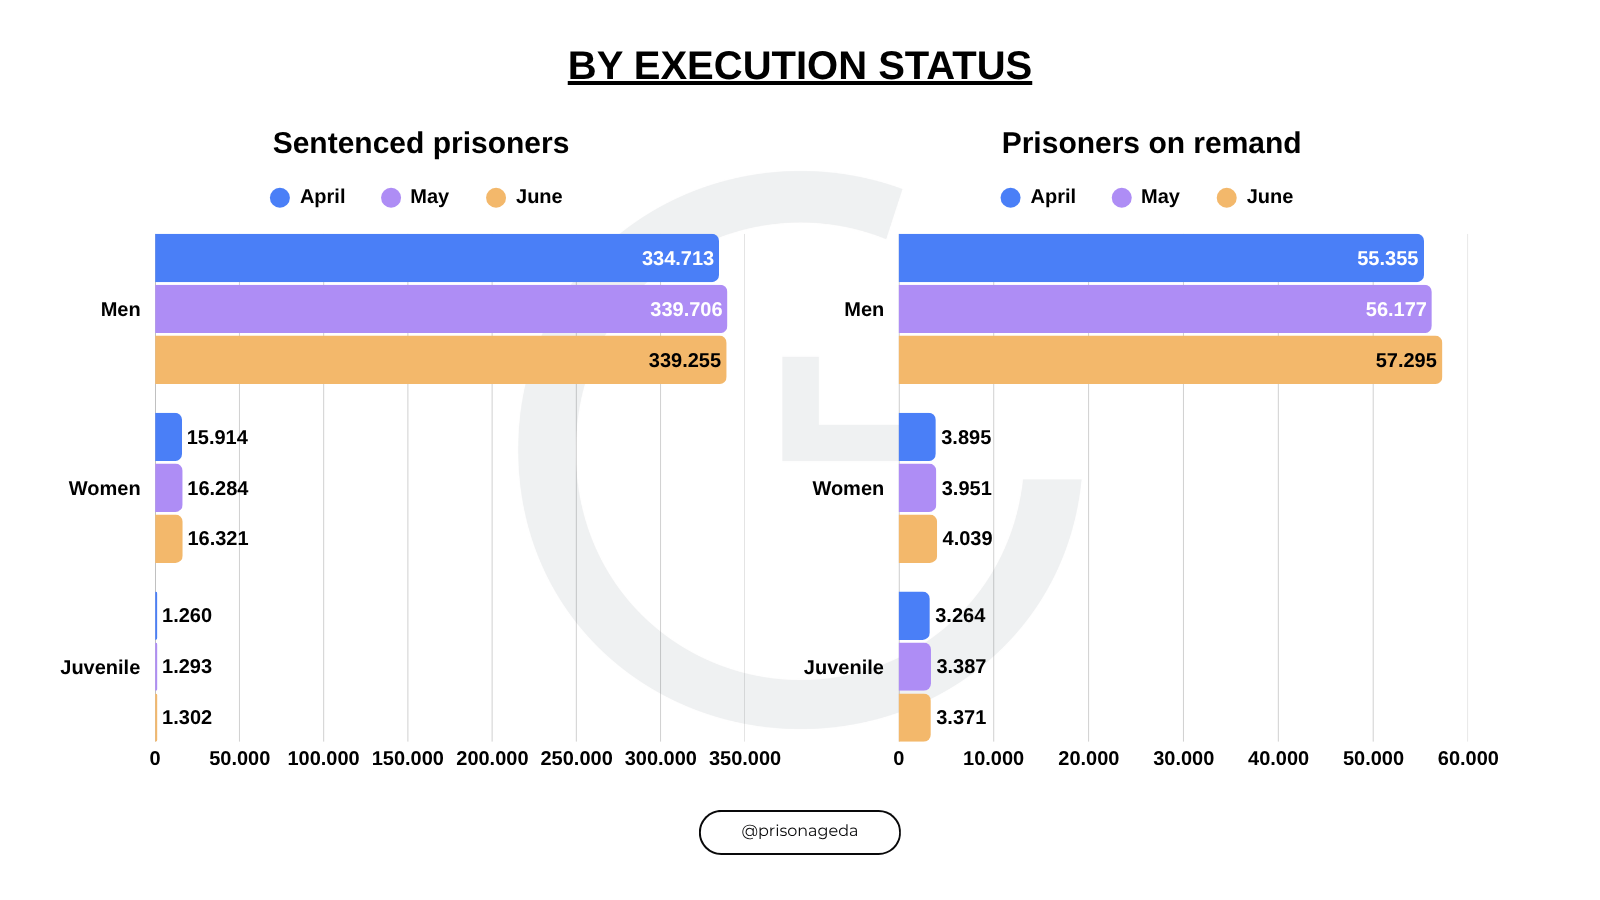
Increase in the sentenced population: The number of sentenced prisoners increased from 351,887 at the start of the second quarter to 356,878 in June. Compared to January’s figure of 338,109, there was a 5.55% increase in the number of sentenced prisoners over the six-month period.
Fluctuations in the number of prisoners on remand: After remaining static in the first quarter, the number of prisoners on remand decreased to 62,514 in April. However, it rose again towards the end of the quarter, reaching 64,705 in June. The total increase in the number of prisoners on remand during the first six months remained limited to 1.25%.
The number of juvenile prisoners is alarming: The number of juveniles sentenced to prison is increasing continuously. In January, there were 1,176 sentenced juveniles in prison, a figure which rose to 1,302 in June. Thus, the increase in the number of sentenced juveniles in prison over the first six months was 10.71%. In contrast, the number of juveniles in prison on remand fluctuated. It increased by 3.88% from 3,245 in January to 3,371 in June.
2. By Prison Status: Repression in closed prisons shows no sign of lessening
Despite judiciary packages and execution regulations facilitating the transition to open prisons, intense pressure on closed prisons continued in the second quarter.
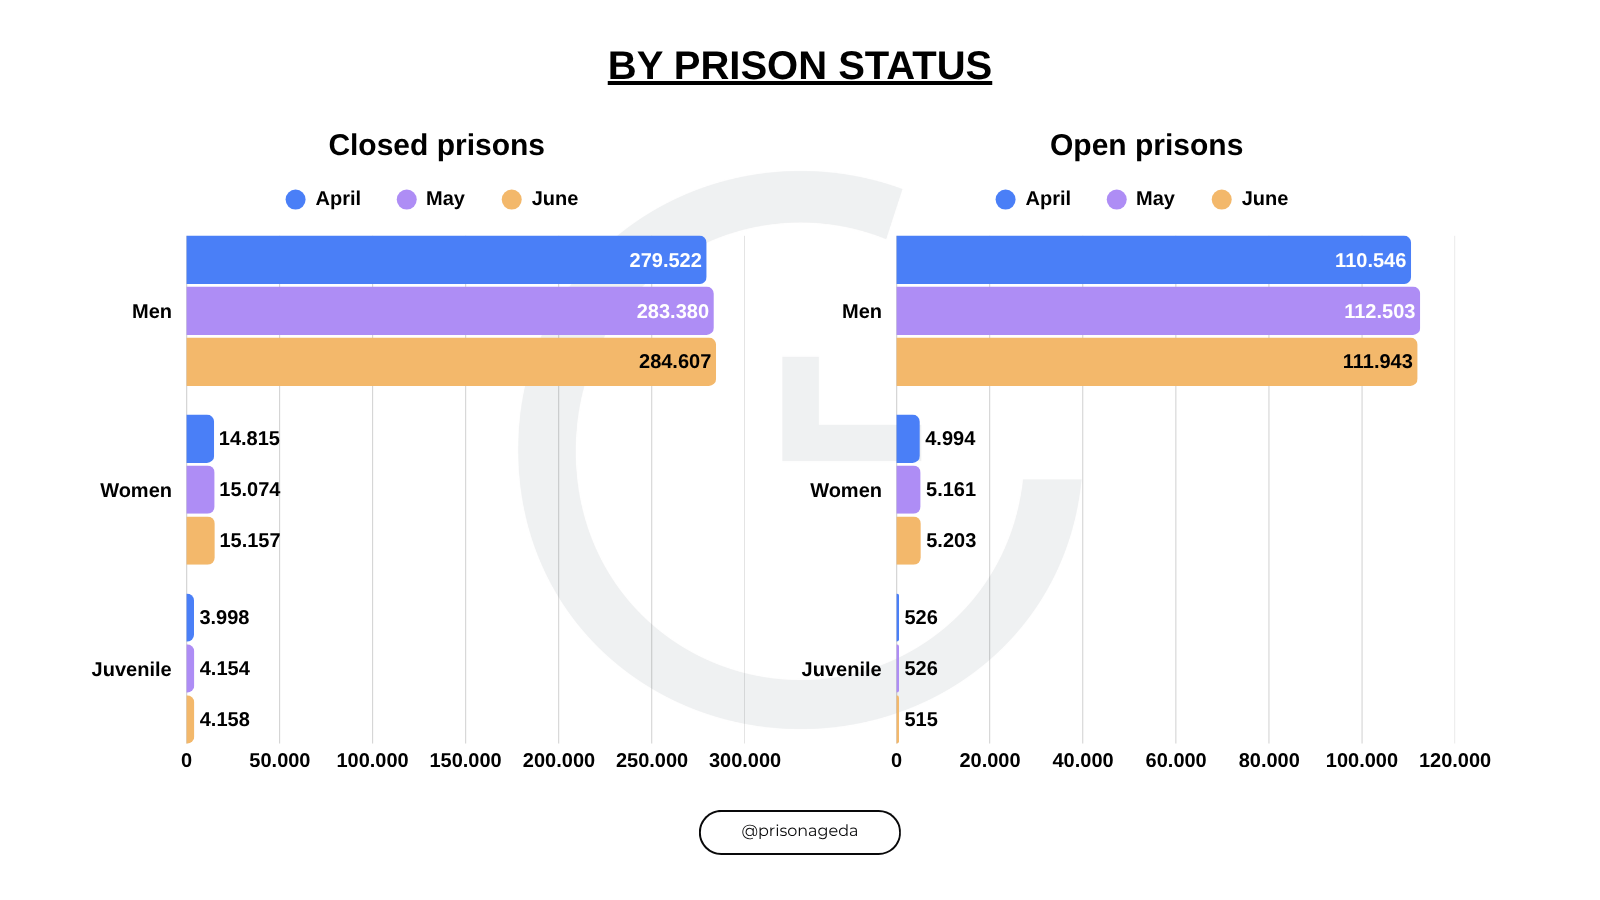
Open prisons: The open prison population, which increased by 5.88% in the first quarter, continued its upward trend in the second quarter as well. The open prison population, which reached its peak with 118,190 in May, dropped to 117,661 in June with a slight decline. Despite this, an increase of 8.88% was recorded in open prisons in the first six months compared to the level of 108,059 people in January.
Closed prisons: The number of prisoners in closed prisons increased again in May and June despite the small decrease in April. The closed prison population, which was 293,955 in January, became 303,922 as of June. Thus, an increase of 3.39% took place in the first six months.
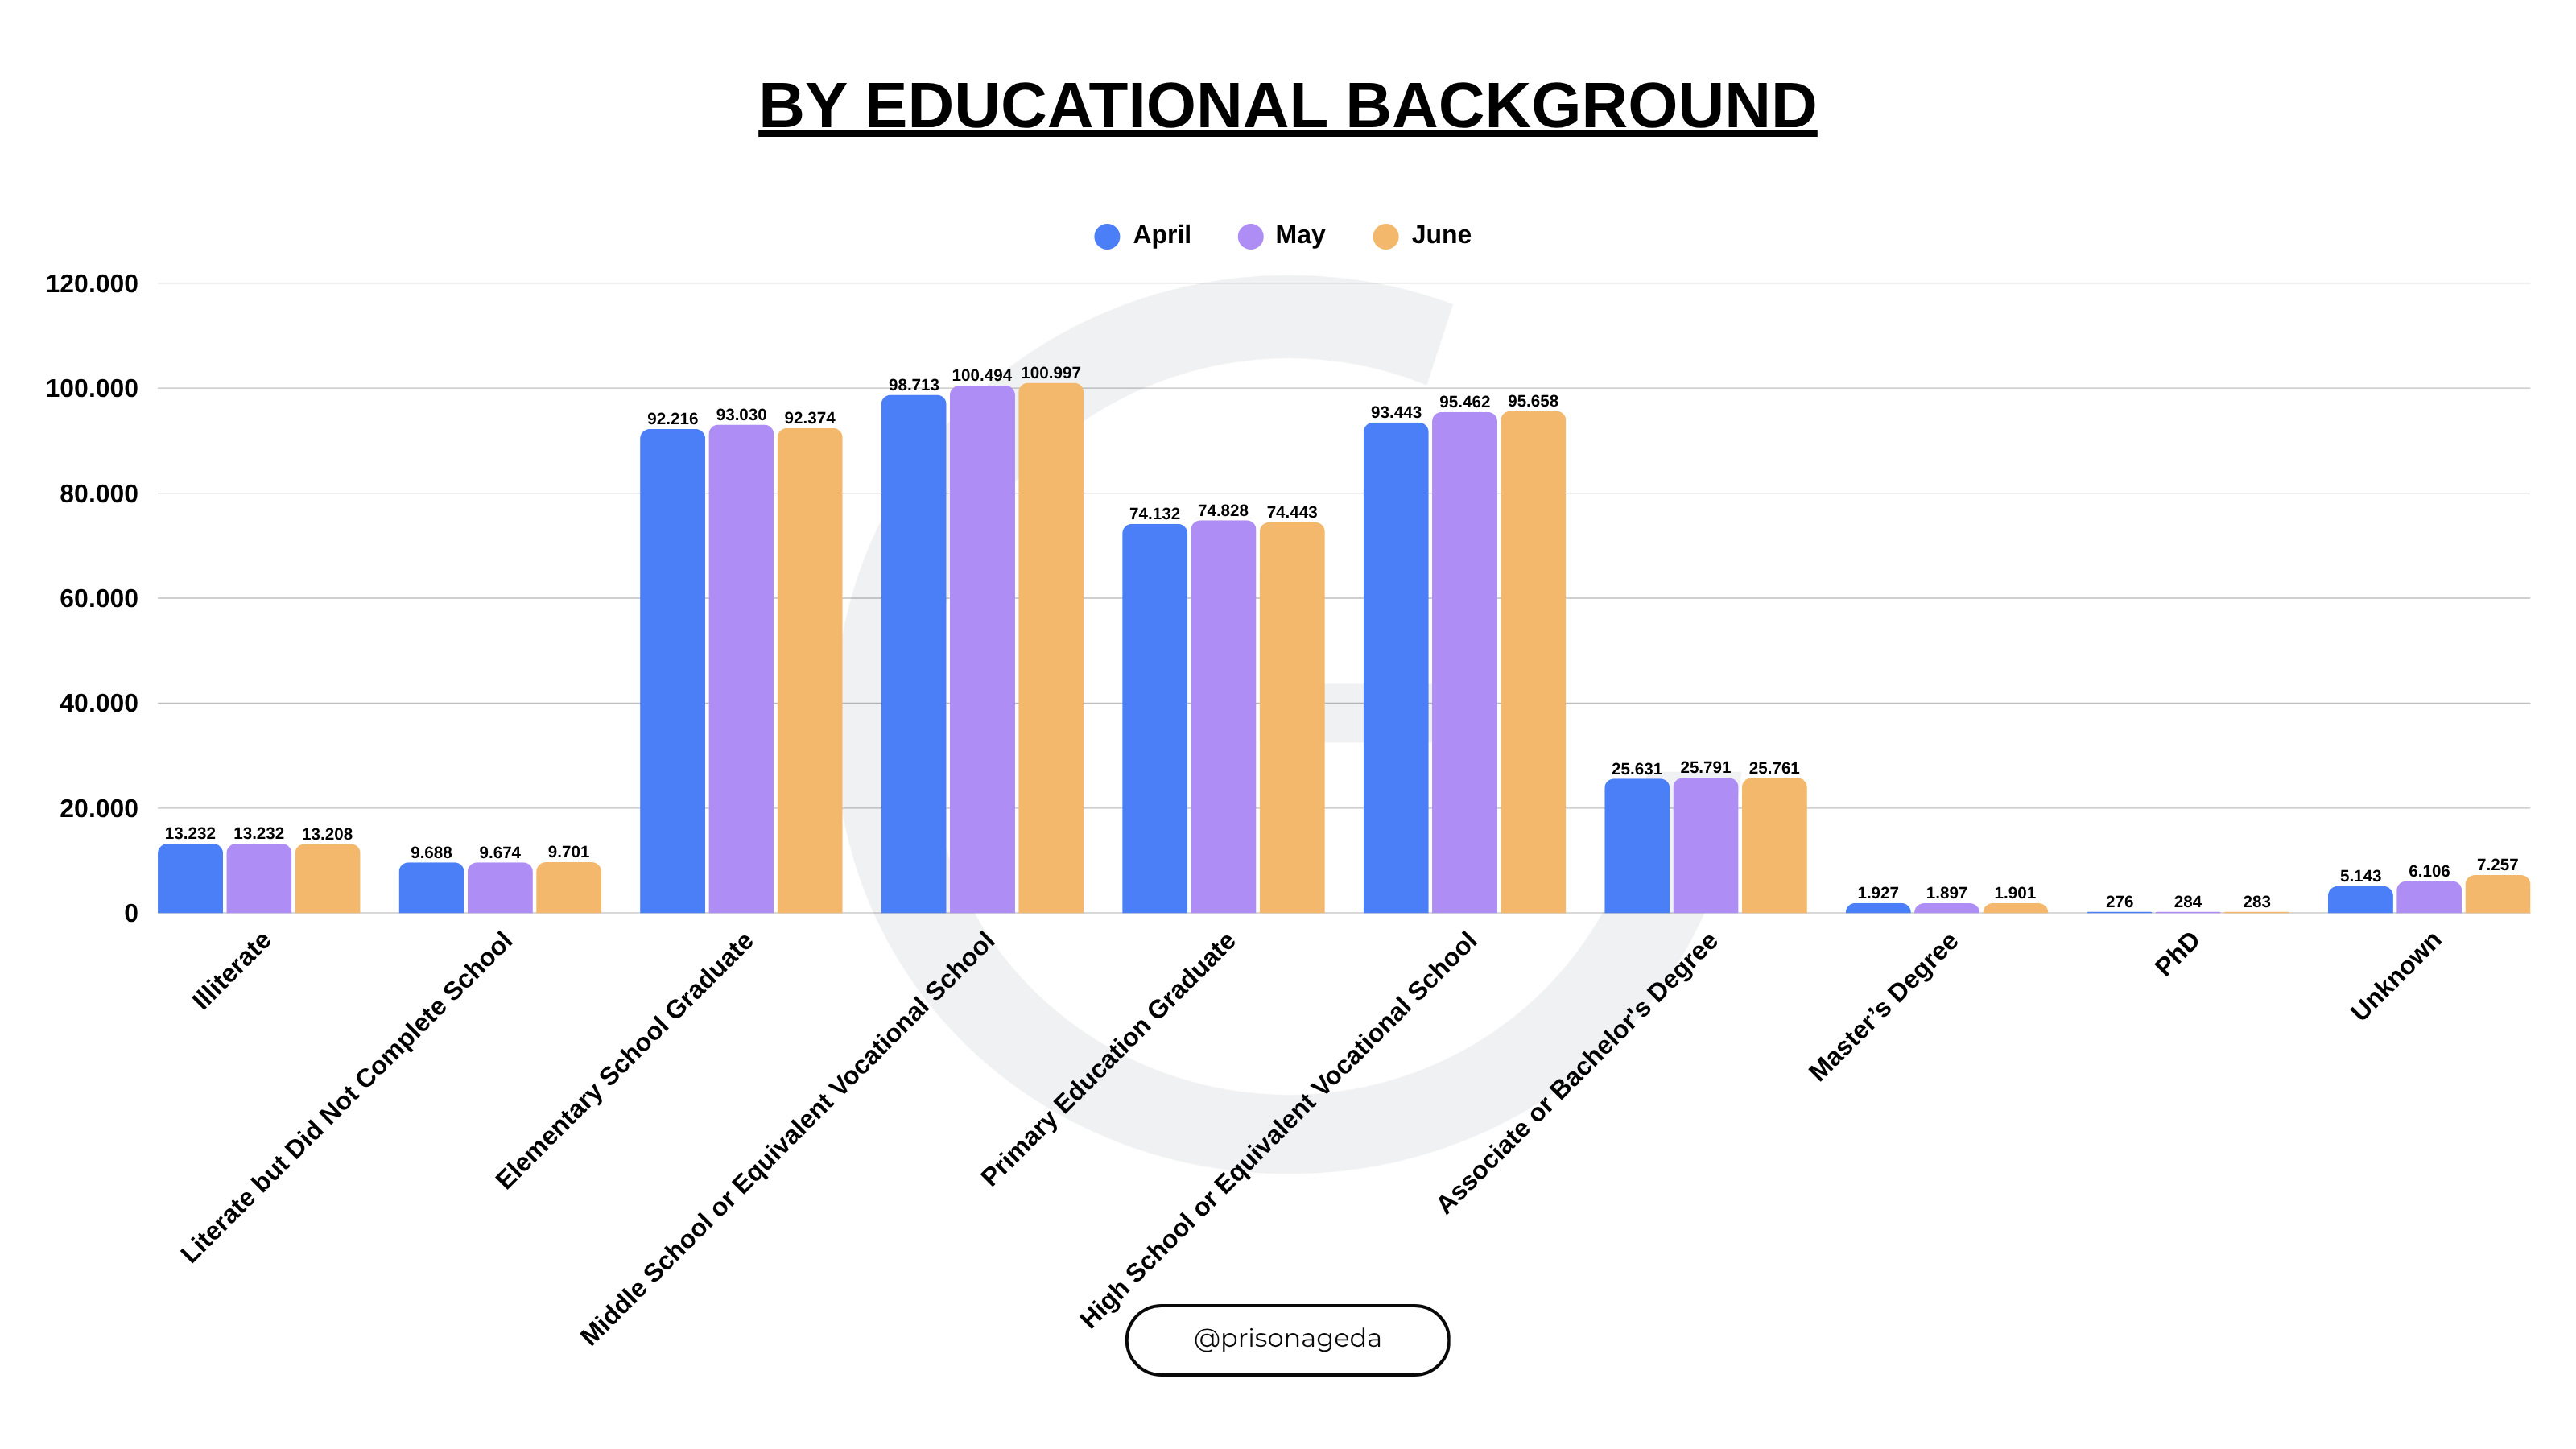
3. By educational background: The ‘Women prisoner with a PhD’ mystery in official statistics
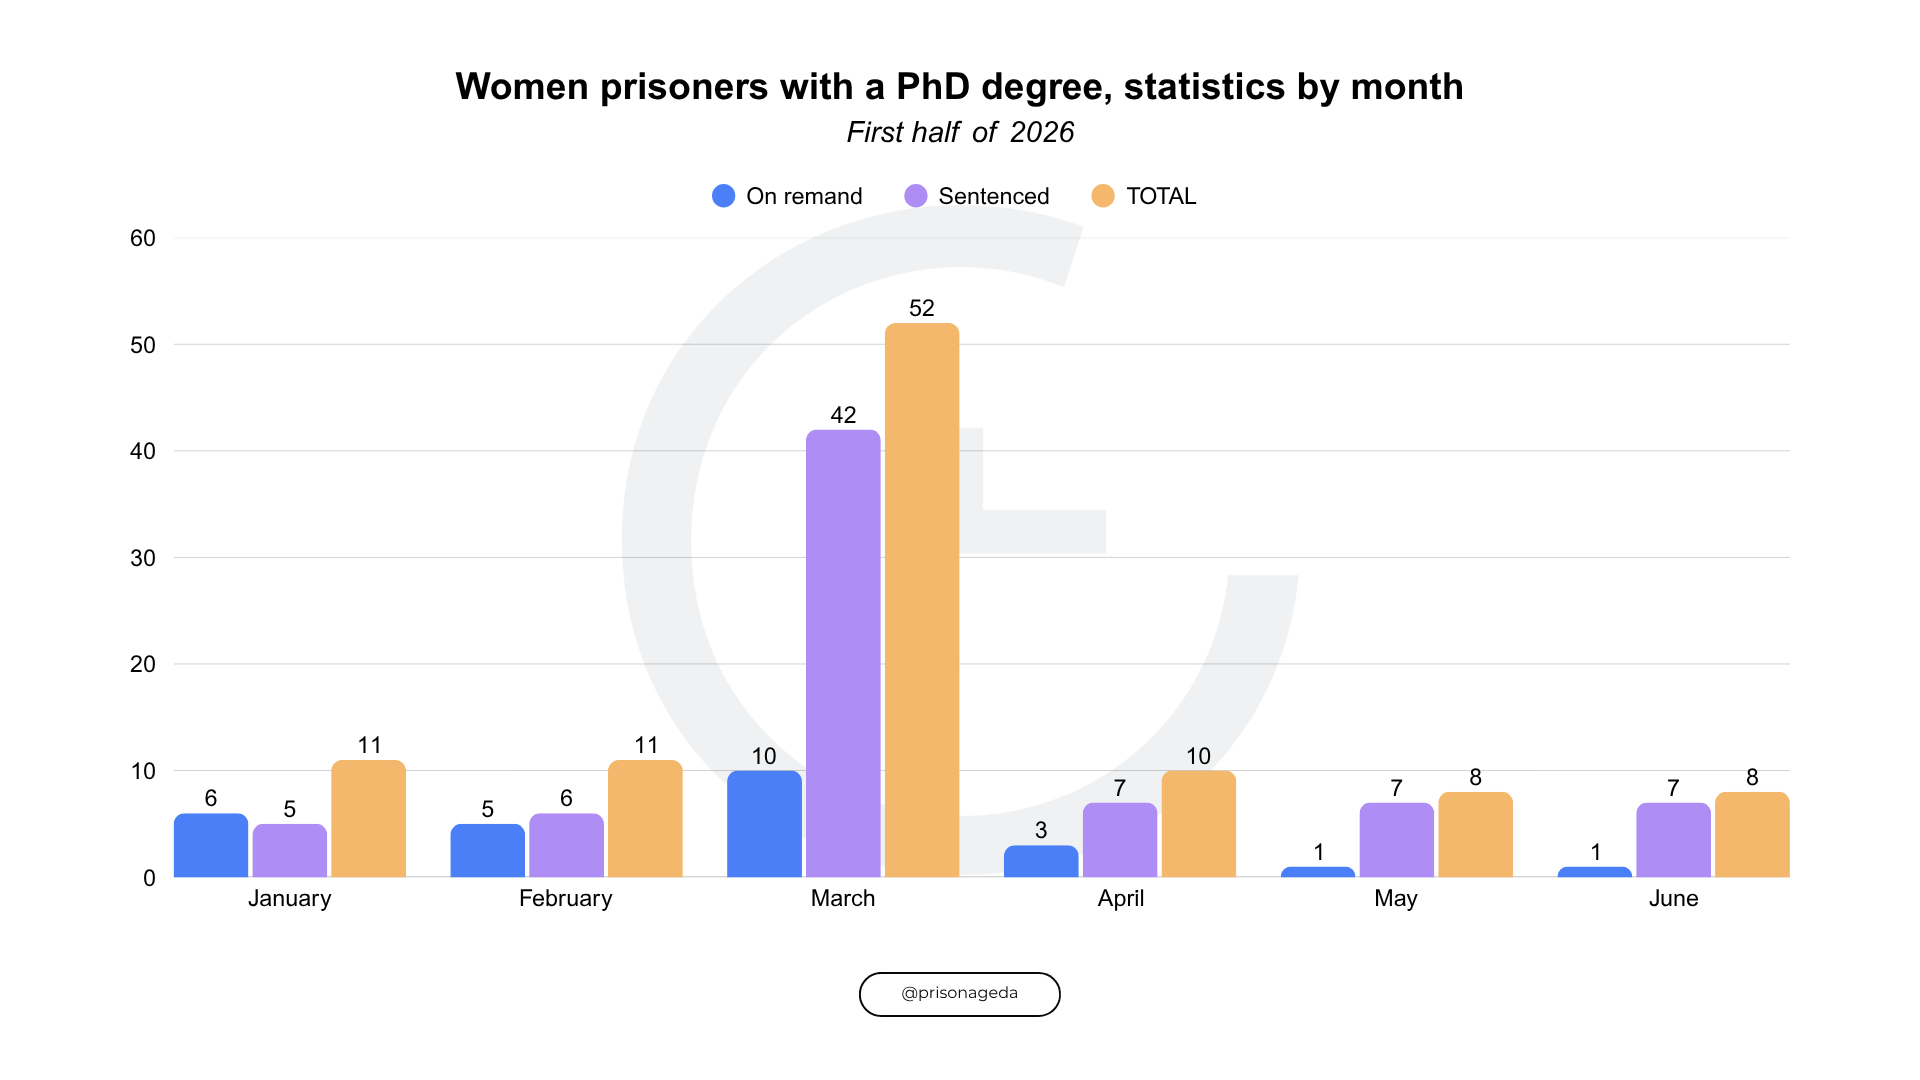
In this section, we’d like to address a notable statistical anomaly in terms of the transparency and reliability of official data. An extraordinary increase occurred in March in the number of women prisoners with a doctorate in the CTE data. While the number of women sentenced prisoners with a PhD remained at 5 in January and 6 in February, it suddenly rose to 42 in March. Similarly, the number of women prisoners on remand with a PhD increased from 5 to 10.
Our application for information submitted to the Ministry of Justice on 28 March 2026 was rejected on the grounds that ‘it does not concern the public and requires a specific study’. However, a quiet revision was made to the official data immediately after the application was accepted into the system.
Examining the data from the second quarter reveals that the number of women prisoners with a PhD fell from a total of 52 (42 sentenced and 10 on remand) in March to 10 (seven sentenced and three on remand) in April, and then to eight in May and June.
This sharp decline in the tables, which was not explained to the public, shows that the increase in March’s data was most likely caused by a systemic registration error, which was corrected during our follow-up process.
4. By Age Groups: The predominant age group in prisons is 18-40
When the distribution by age groups is examined, the prison population continues to consist predominantly of young, productive age groups.
Ages 18-40: This group constitutes approximately 65% of the prison population and reached 275,565 people in June. This represents an increase of 11,938 people since January, when the figure stood at 263,627.
Ages 40-65: This age group, which showed a steady growth throughout the second quarter, reached 134,665 people in June. The total increase rate in the first six months was 5.47%.
Ages 65+: The number of elderly prisoners, who are among the most vulnerable groups in prisons, continues to increase. This figure stood at 6,572 at the end of the first quarter, reaching a peak of 6,724 in May before declining to 6,680 in June. This represents an increase of 6.28% compared to the level of 6,285 people in January.
5. Probation: On the threshold of half a million
The probation system continues to cover a large population who are not in prison but are under the supervision of the judicial system. The total number of probation cases decreased to 489 thousand in the first quarter but increased to 499,588 by May, approaching the half-million threshold.
Distribution by type of probation
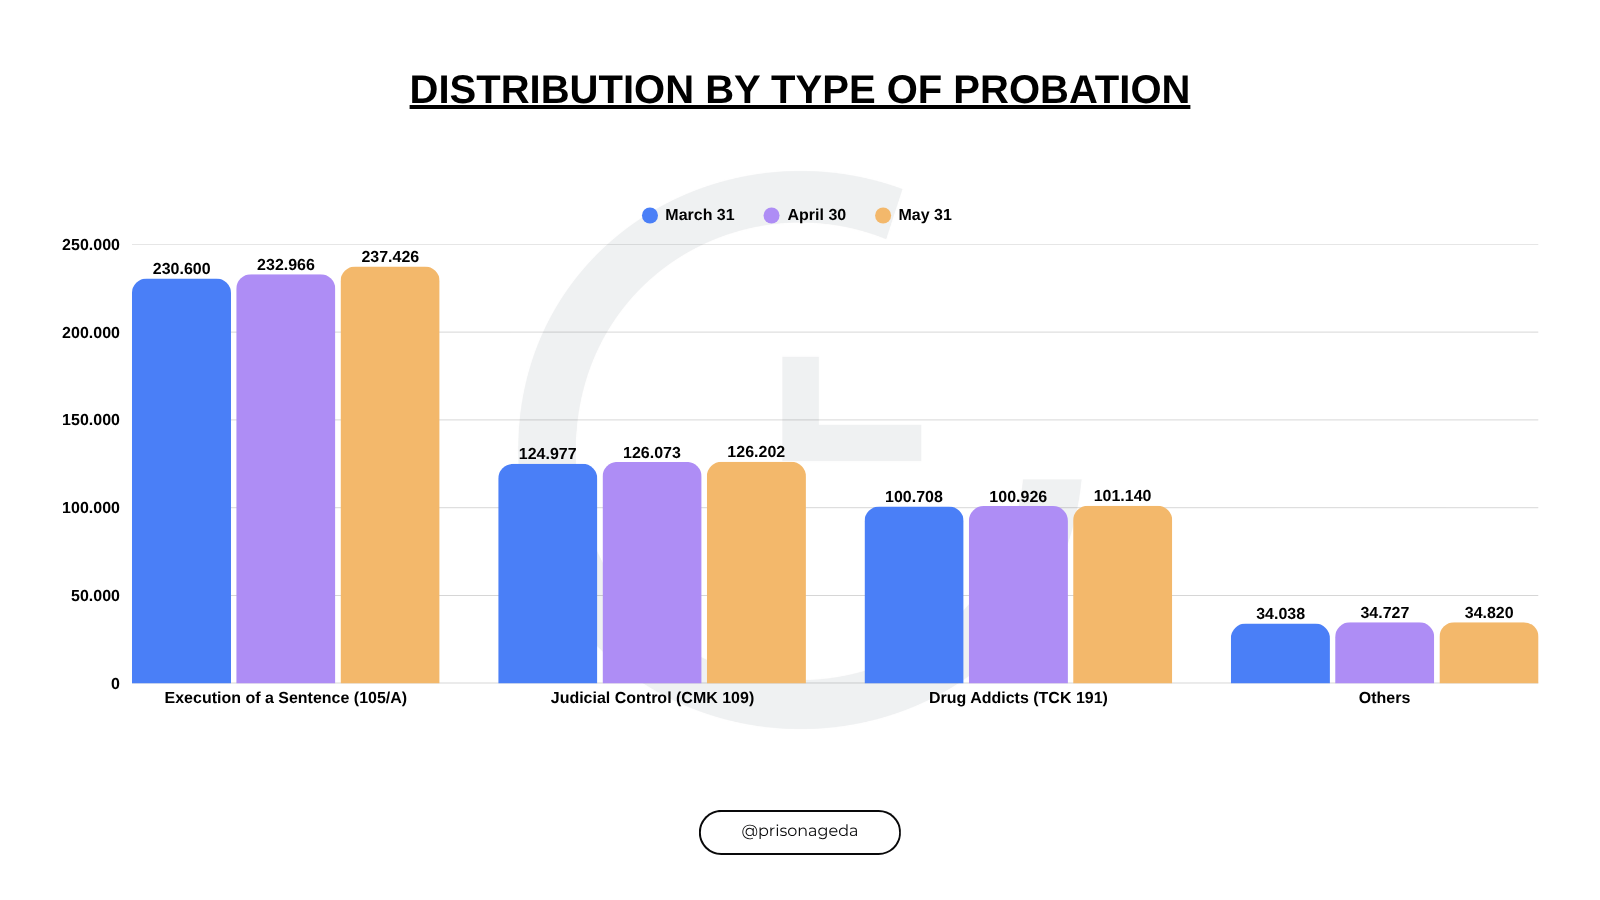
Execution of a Sentence (105/A): The number of files in this category, which is the largest group under probation, continued to increase. At the end of March, the number of files was 230,600; by the end of May, this figure had risen to 237,426. The increase over the five months from January to the end of May was 5.18%.
Judicial Control (CMK 109): After falling in the first quarter, numbers rose again in the second. It reached 126,202 by the end of May.
Drug Addiction (TCK 191):After remaining stable, the number of cases in this category stood at 101,140 at the end of May.
Probation by ages
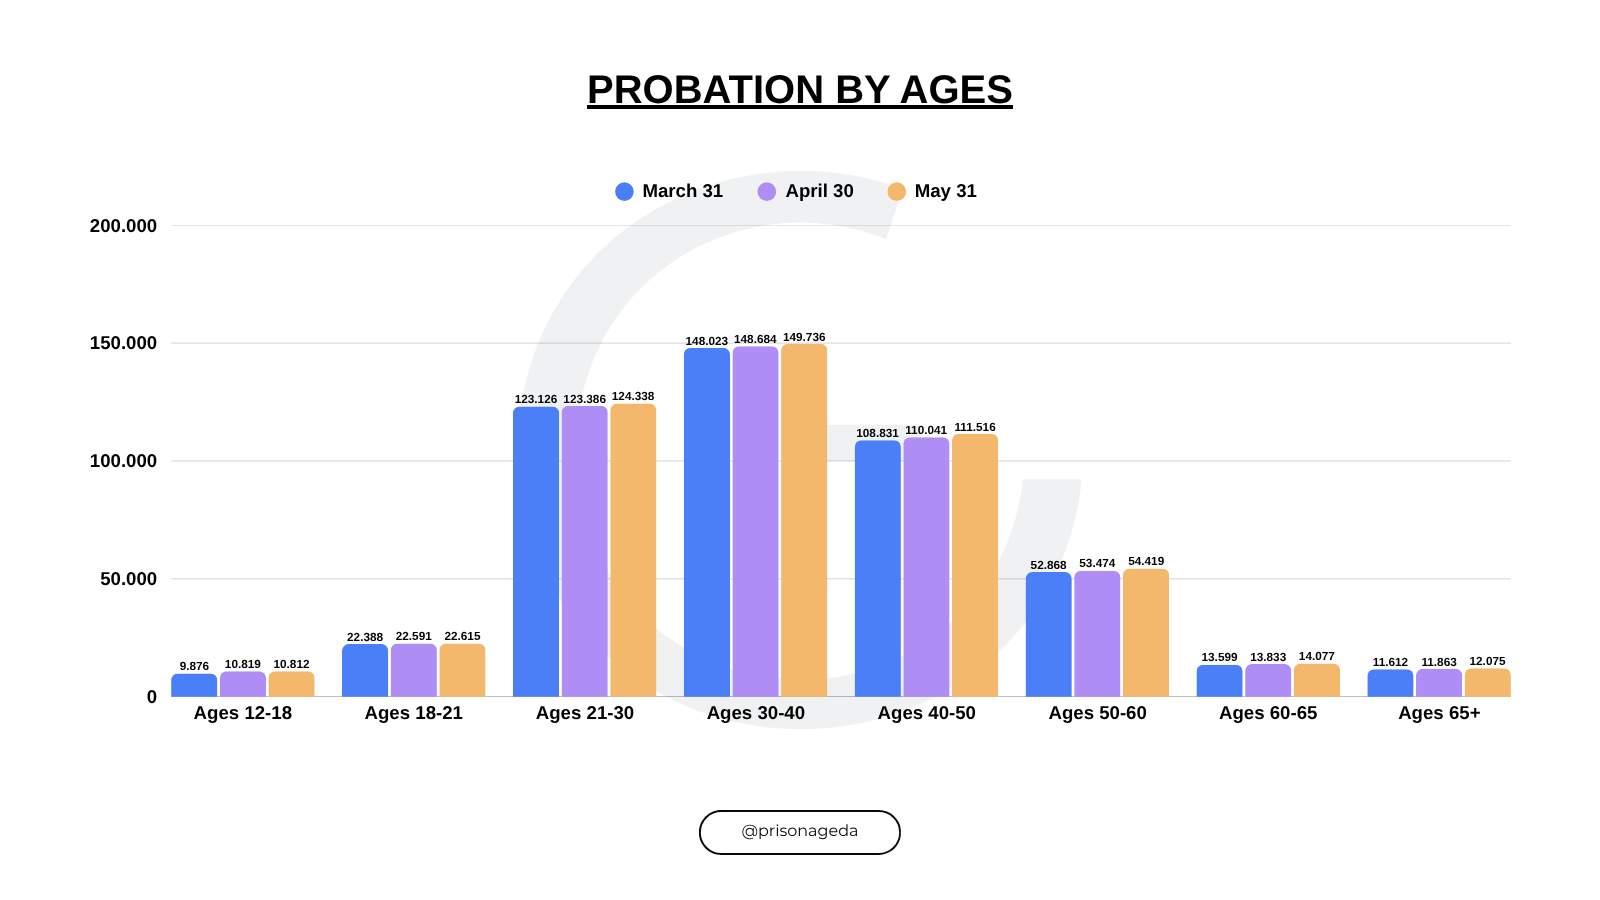
77.2% of people under probation are between the ages of 21 and 50. The largest group is those aged 30–40, accounting for 30% of the total, followed by the 21–30 age group at 24.9% and the 40–50 age group at 22.3%.
The probation population generally increased between March and May 2026. The rise was particularly noticeable among middle-aged and older groups, while the change in the 18–21 age group remained very limited.
Overview
As the first half of 2026 comes to a close, the data reveals that the partial execution regulations made could not reduce the capacity problem and population growth in prisons.
With a total prison population of over 421,000 and nearly 500,000 individuals on probation, it is clear that almost one million people in Türkiye are directly involved in the criminal justice system.
In the coming quarter, we will continue to monitor rights violations caused by overcrowding, especially in closed prisons, as well as the increase in the number of juvenile prisoners and general trends within the execution system.